
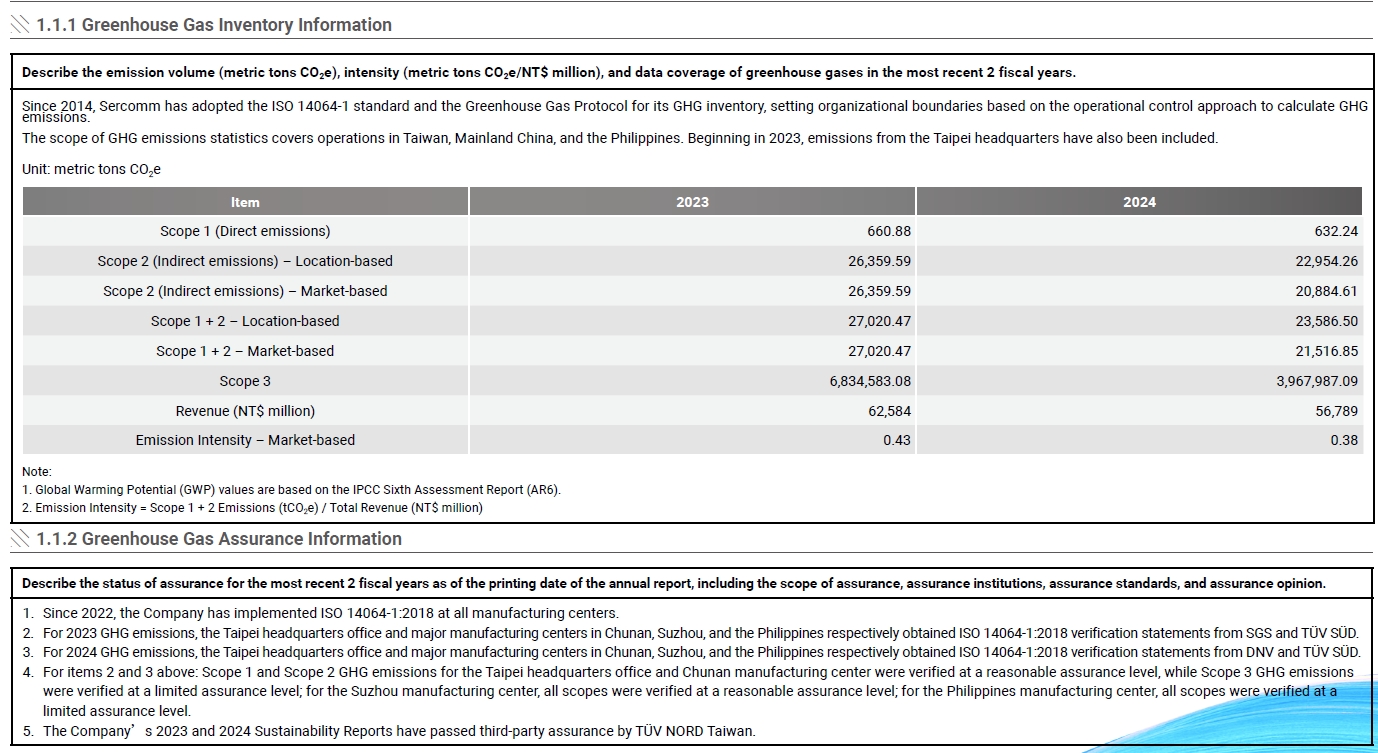
of the GHG inventory.
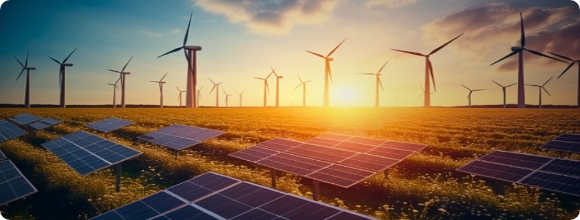
Emission intensity in 2022
compared to 2021
Absolute emission in 2022
compared to 2021
Sercomm Environmental, Health and Safety (EHS) Policy
1. Comply with laws and regulations:
Comply with environmental laws and requirements of the International Covenant to become a green corporation implementing sustainable development. Abide by the environmental health and safety and energy-related voluntary commitments.
2. Minimize environmental impact:
Improve waste reduction and pollution prevention from the origin, in order to achieve the goal of green design, production and management Reduce air and water pollution and waste generation.
3. Construct a safe and healthy working environment:
Implement preventive management to ensure the safety of working environment and operations, so as to bring comfort to employees and confidence to customers Prevent workplace injuries and create a safe working environment.
4. Set environmental goals and continue to improve:
Periodically review, audit, examine and improve operations Implement the environmental management system and blend it into the overall organizational management system, and strives to consistent improvement.
5. Implant the culture of sustainability:
Promote the environmental ethics and raise the environmental awareness. Meanwhile, through staff trainings and the implementation of ISO 14001, ensure all employees understand and fulfill their responsibilities of environmental protection. For operating personnel and contractors, implement education and trainings according to the safety and health management plans, to ensure the policy and management system of safety and health are understood thoroughly.

Environmental Management Indicators
| Topic | Management Indicator | 2024 Results | Short-term Target (2025–2029) | Mid-to-Long-Term Target (2030) |
|---|---|---|---|---|
| Greenhouse Gas Management | Scope 1 and Scope 2 emissions | 20.37% reduction compared to 2023 | 8% annual reduction | 42% reduction from the base year |
| Scope 3 emissions | 41.94% reduction compared to 2023 | 4% annual reduction | 25% reduction from the base year | |
| Energy Management | Percentage of renewable energy in total electricity consumption (%) | 11.35 | 80 | 90 |
| Waste Management | Waste intensity (tons / NT$ million) |
0.0433 | ≤ 0.04 | ≤ 0.035 |
| Water Resource Management | Water intensity (ML / NT$ million) |
0.0033 | ≤ 0.0030 | ≤ 0.0028 |
Environmental-Related Certifications
Sercomm has obtained the following internationally recognized environmental certifications:
- ISO 14001
- ISO 50001
- ISO 14064-1
- LEED
- Forest Stewardship Council (FSC) certification
Water Consumption Statistics Over the Past Four Years
Unit: Megaliters (ML)
| Category | 2021 | 2022 | 2023 | 2024 |
|---|---|---|---|---|
| Water Withdrawal | 235.71 | 240.85 | 214.21 | 184.63 |
| Water Discharge | 202.77 | 207.15 | 184.75 | 166.16 |
| Water Consumption | 32.94 | 33.70 | 29.46 | 18.46 |
| Water Intensity (Total Water Withdrawal / NT$ million) |
0.0054 | 0.0037 | 0.0034 | 0.0033 |
- 1 Megaliter = 1,000 kiloliters (kL)
- 1 metric ton = 1,000 liters
- 1 cubic meter (m³) = 1,000 liters; thus, 1 Megaliter = 1,000 m³
- In 2024, the water discharge volume for all plants was uniformly calculated based on the method used by the Kuan-Yuan Science and Technology Park, i.e., 90% of the total water withdrawal. Water consumption = Water withdrawal – Water discharge
Total Waste Weight and Intensity over the Past Four Years
Unit: metric tons
| Category | 2021 | 2022 | 2023 | 2024 |
|---|---|---|---|---|
| Total Hazardous Waste Weight | 140.88 | 207.49 | 172.48 | 144.79 |
| Total Non-Hazardous Waste Weight | 4,293.93 | 4,455.51 | 2,830.16 | 2,312.79 |
| Total Waste Weight | 4,434.81 | 4,663.00 | 3,002.64 | 2,457.58 |
| Intensity (Hazardous Waste) | 0.0032 | 0.0032 | 0.0028 | 0.0025 |
| Intensity (Non-Hazardous Waste) | 0.0978 | 0.0690 | 0.0452 | 0.0407 |
| Intensity (Total Waste) | 0.1010 | 0.0722 | 0.0480 | 0.0433 |
- The scope of statistics covers the Chunan, Suzhou, and Philippines manufacturing centers.
- Intensity = Total weight of the respective category / Revenue (NT$ million).
- This statistical table includes restatements of information, primarily to correct the non-hazardous waste data from the Philippines manufacturing center, which affects the calculation of total waste weight and intensity.
by 2050
by 2030
by 2030
>8% Carbon Reduction

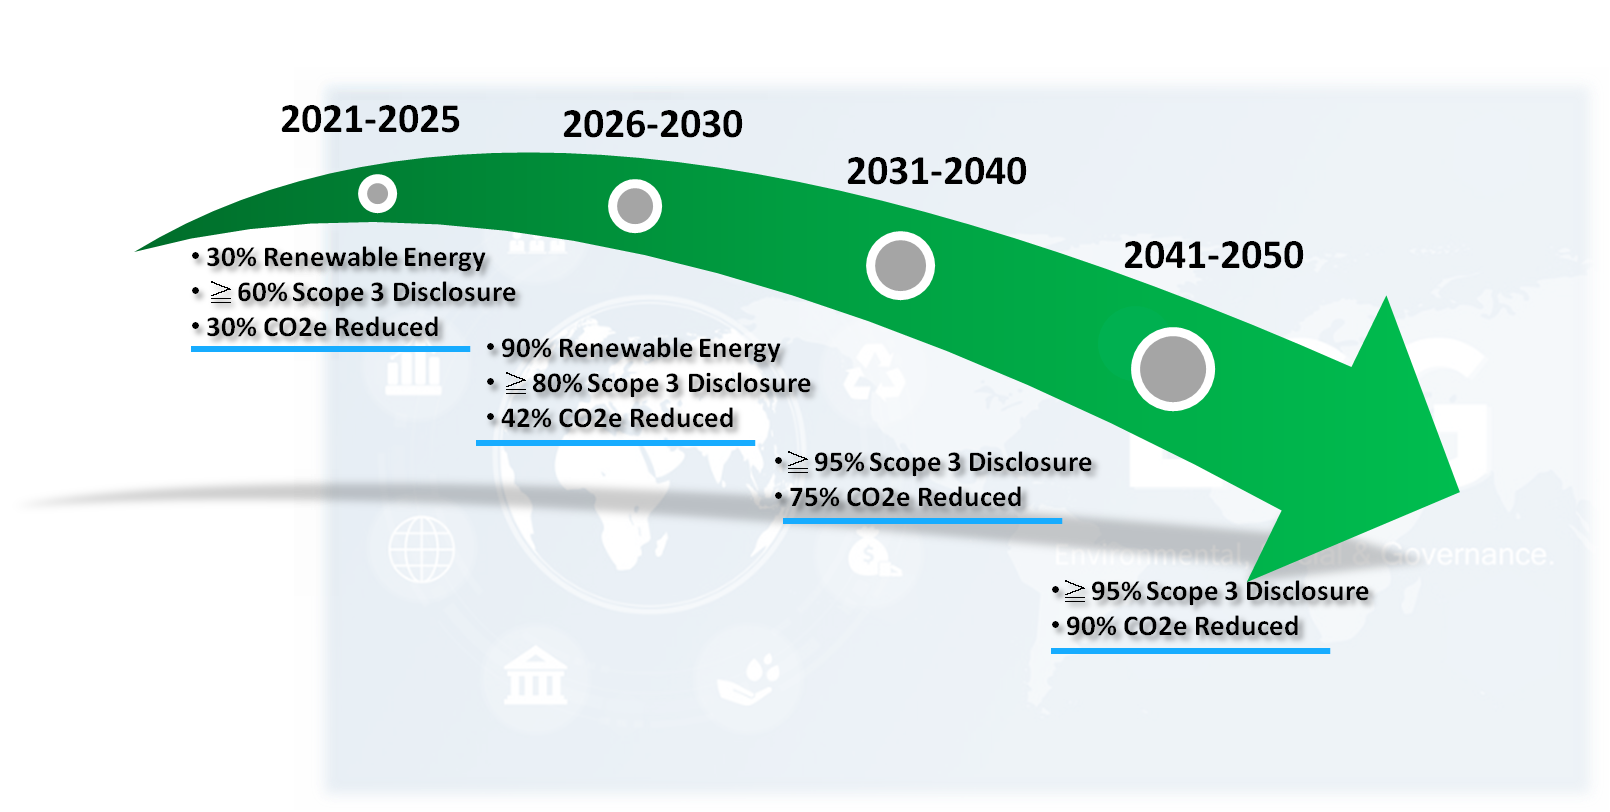

NetZero